Video completion rate (VCR) is one of the easiest numbers to feel good about. After all, a completed view does sound like a watched ad. Well, not exactly. In reality, plenty of those completions play out muted, in a player that has shrunk into a corner, or long after the reader has scrolled past. And the dashboard counts every one of them the same way.
VCR shapes how online video (OLV) gets planned and judged. If the completions were never seen, a low cost per completed view looks efficient when it is not. The fix is to count completions only where someone could actually see the video, and to buy placements where that happens most.
What is video completion rate (VCR)?
Video completion rate (VCR) is the share of video ads that play through to the end, out of all the video ads that started.
Or, as a formula: VCR = (completed views / video starts) × 100.
A campaign with 1,000 starts and 700 completions has a VCR of 70%. A completion is usually logged once the player fires its 100% quartile event, the signal that the ad reached its last frame.
That event records what the player did, not what the viewer did. It fires either way, whether the ad played in full view with sound on, or muted in a player nobody was looking at. VCR inherits the same blind spot: it measures how often video ads finish, not how often they are watched.
What is a good video completion rate?
It is complicated, because a good video completion rate is one that measures views someone genuinely watched, and there is no reliable industry benchmark for that. On top of that, most existing figures are old and rarely agree on what sits underneath the percentage.
The denominator is the first problem. Some platforms divide completions by video starts, others by impressions, and still others by viewable impressions. So the same campaign can report three different VCRs depending on which one is used. Format adds more noise, since a non-skippable pre-roll and an outstream unit that autoplays mid-article will never produce comparable numbers.
Page setup skews things even further. 35% of pages load multiple videos at the same time, and 12% of sites have more than one video playing at once. Every one of those players can log a completion. The reader, meanwhile, is watching one of them at best. So the better question is not whether a VCR is good, but how many of the completions behind it were seen.
Why are completion rates inflated?
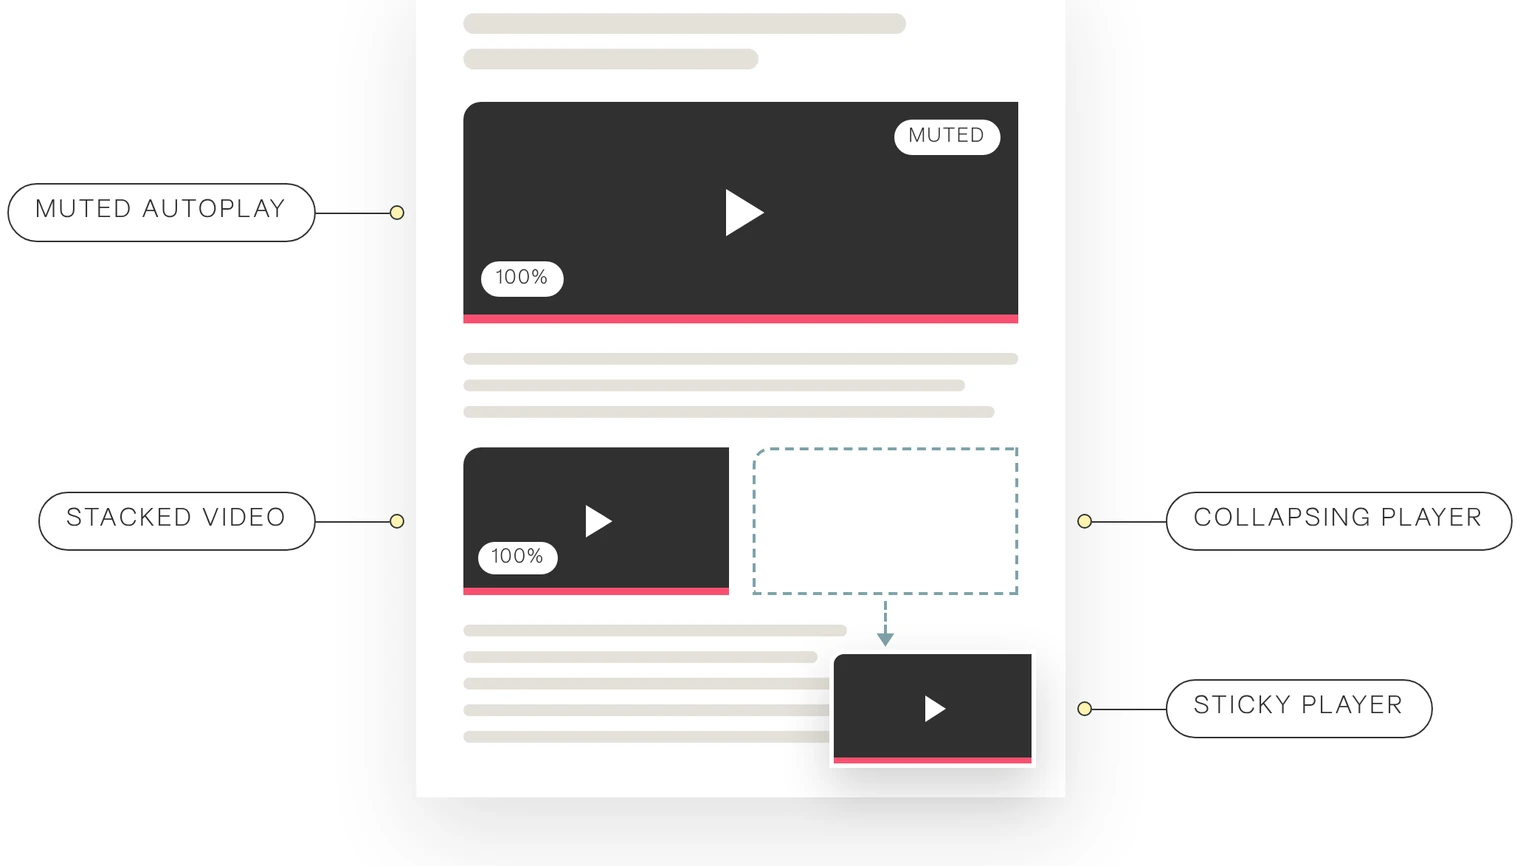
Completion rates are inflated because the player keeps counting regardless of whether the viewer has long stopped watching or never started. A handful of setups do most of the damage.
Muted autoplay video starts on its own and runs to the end whether or not anyone looks at it. For a format built on sight and sound, it can complete without delivering either. Sticky players follow the reader down the page, pinned to a corner. The ad stays technically on screen, but it shrinks to a fraction of its original size. Collapsing players go even further: they fold into a smaller unit as the reader scrolls, often before the ad has had a chance to be seen at full size. Then there are pages that stack video. Several videos load or run at once, each one reporting a completion, while there is just one reader. This maths does not add up.
Yet none of this shows up in VCR, which is how a strong completion rate can sit on top of very little actual viewing.
What makes a video placement more likely to be watched?
A video placement is more likely to be watched when the player is big enough to notice, pauses once it is out of view, plays with sound and starts because someone chose to hit play.
A video that fills a generous share of the screen competes for attention, while a small one can run its course unnoticed. Pausing out of view keeps the count clean, because a player that stops when scrolled away can only finish while someone can see it. Sound on by default means the ad is heard as well as seen. And a video the user pressed play on starts with someone already paying attention, which autoplay cannot guarantee.
Out of PIQ’s 100+ signals, these are some of the video ones:
| Signal | What PIQ checks | Why it matters for VCR |
|---|---|---|
| Average share of screen | How much of the screen the player takes up while it is in view | A small player can complete without anyone noticing |
| Pause out of view | Whether the player pauses once it is scrolled off screen | Players that keep running off screen rack up completions nobody saw |
| Integration behaviour | Whether the player stays fixed, follows the reader (sticky) or collapses from a large player into a sticky unit | Sticky and collapsing players shrink the ad as people read on |
| Concurrent players | Whether more than one video player runs at the same time on a page | With two videos running, at most one is being watched |
| Sound-on by default | How often the player starts with sound on | Muted autoplay can complete without ever being heard |
| Auto-play by default | How often video starts without the user pressing play | Auto-played views count as completions even when nobody chose to watch |
How does Picnic’s inventory quality improve genuine completions?
Inventory quality turns completions back into views, by keeping budget away from players that run their course unwatched. And those players are not rare. 15% of videos keep playing when the user scrolls them out of view, and 30% of open-web videos collapse into smaller units before they are seen.
PIQ, Picnic Inventory Quality, scores every placement from 0 to 100. Weighted for Video Views, five signals are the key to improvement: integration behaviour, average share of screen, pause out of view, concurrent players and loading speed, with signals such as sound and autoplay still part of the overall score. For OLV, that means a placement with a large player that pauses out of view scores very differently from one that autoplays muted and follows the reader down the page.
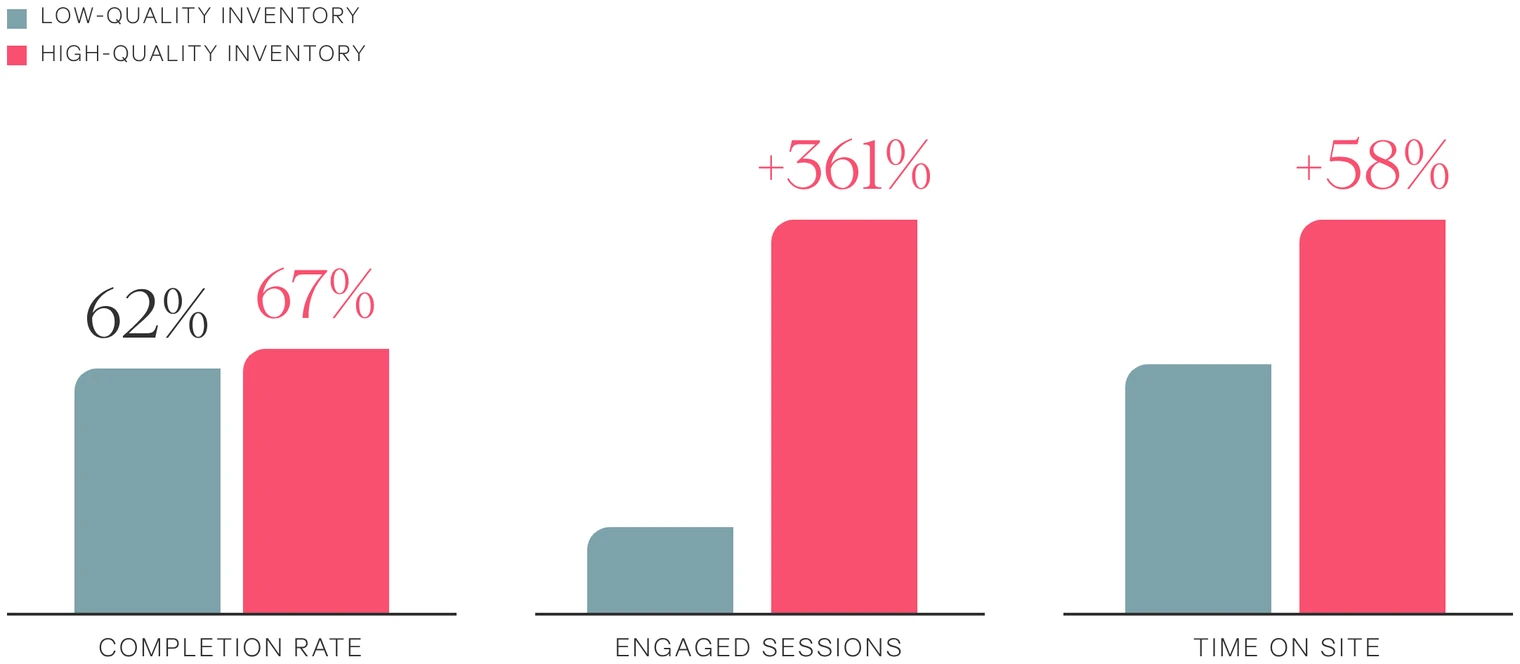
Picnic has seen this play out in a past campaign. When a UK public sector client ran the same OLV creative on high- and low-quality inventory, completion rates barely moved: 67% against 62%. What happened after the view did. The high-quality side, limited to medium and large players, drove 361% more engaged sessions and 58% longer time on site. Two placements can report near-identical VCRs and deliver very different value. Scoring each placement before the bid is how completions start to reflect real viewing.
How do Picnic’s Optimised PMPs improve video completion rate?
Picnic’s Video Views Optimised PMP improves video completion rate by concentrating delivery on placements where the video is seen through to the end, away from the sticky, collapsing and stacked ones. Buying it does not change the workflow: it is a single deal ID in the buyer’s current DSP, with Video Views set as the campaign objective and Picnic’s model running, in real time, behind it.
The campaign does not start cold. From launch, PIQ combines video quality signals with historical campaign data to find placements likely to deliver completions someone could see. Once it is running, completions are traced back to the placements that produced them, and Picnic’s bidding algorithm shifts spend towards the ones that deliver.
The Video Views solution optimises for two KPIs:
- Video completion rate (VCR): the share of impressions that complete, weighted by each placement’s PIQ score. Measured against impressions rather than starts, it is the stricter version of the metric.
- Cost per video completion (CPVC): the average media spend for a single completion in a placement where it could be seen.
The payoff is a VCR that means what it says. Fewer completions come from players nobody was watching, cost per completed view reflects views that really happened, and budget moves to placements where the ad is seen, and heard, to the end.
Video Views is one of four campaign objectives an optimised PMP can be built around, alongside Brand Lift, Effective Reach and Quality Traffic. The Optimised PMPs hub covers how the wider model works across all four.
Want to find out how many of your completed views were actually seen?
Book a demo with the Picnic team.
You may also like
All articles Industry
Effective reach: how to grow unique reach without wasting ad spend.
Unique reach is not always unique. How effective reach and placement-level inventory quality grow reach among the people who actually see the ad.
Read article Industry
Brand lift studies: how to act on results before the campaign ends.
Brand lift studies usually land after the campaign ends. How in-flight measurement turns a brand lift study into a live signal you can act on.
Read article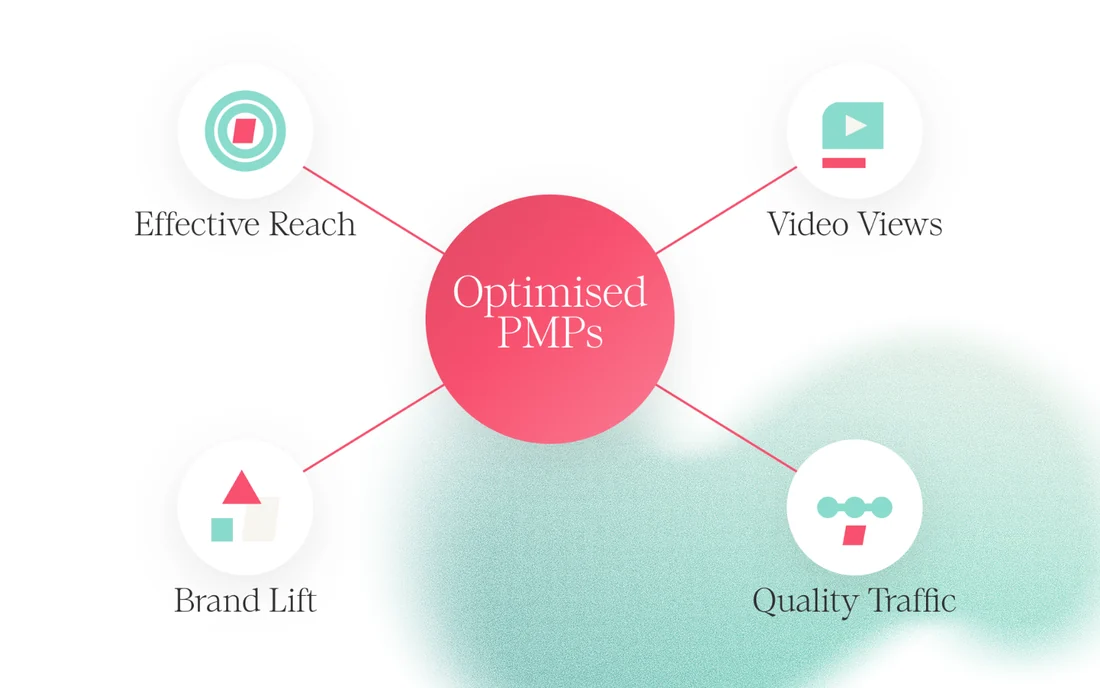 Product
Optimised PMPs: Putting Placement-Level Quality Into Every Bid.
Deals that combine PIQ placement-level quality data with live performance data to decide which impressions to bid on, and how much each is worth, in the DSPs buyers already use.
Read article